As much as we would like to believe science to be a definitive process, it is often riddled with ambiguity. This is specifically apparent when it comes to applications of enhanced oil recovery (EOR), where conventional testing gives us only a snapshot of what a reservoir looks like. Operators of EOR processes find it particularly frustrating as most well sites are in regions of varying permeability, meaning that a chemical selected based on one region may not be ideal when the entirety of a well’s conditions are considered. These issues become even more prevalent when thief zones are present within a reservoir site. As their name suggests, these high permeability regions often “steal” injected fluid, preventing it from reaching areas of lower permeability and decreasing the overall volume of oil recovered.
Comparing Interface’s Microfluidic Chip to Industry Standard processes of Studying Thief Zones
The current industry approach to understand thief zones involves using core samples and sandpacks that are modified to include high permeability regions. These techniques, however, fail to isolate the effect thief zones have on total oil recovery and required a large volume of sample. To add insult to injury, these assays are relatively cumbersome and can take a decent amount of time to set up and run. Moreover, the core samples and sandpacks are different from test to test, making direct comparison of the chemicals nearly impossible.
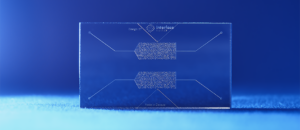
In juxtaposition, Interface designs and fabricates reservoir analogues with reservoir relevant pore-scale properties that allow high-resolution optical access to resolve the mechanisms occurring in the pore networks during the testing process while maintaining relevant temperature and pressure. Furthermore, the Interface testing system requires small sample volumes and requires much less time to set up. The tight control overflow conditions, consistent reservoir analogue and image-based analysis that we generate enables direct and rapid chemical and process comparisons.
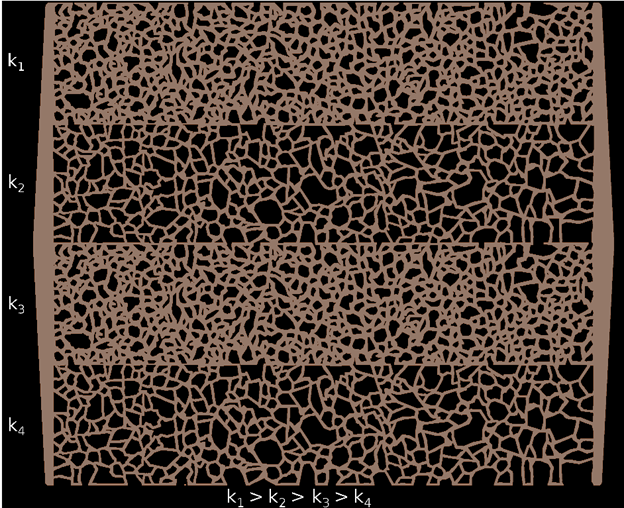
For evaluating the performance of polymers in reservoirs with thief zones, we have developed a microfluidic device that contains four connected but distinct zones with decreasing permeability from top to bottom, shown in Figure 1. In the analogue, zones k1 and k2 have deeper pore networks than zones k3 and k4, and zones k1 and k3 have greater porosity than zones k2 and k4. Additional properties of each zone are listed in Table 1. Using this microfluidic device, we can resolve the fluid dynamics and oil displacement when polymer flooding encounters thief zones in the reservoir.

What does a polymer flood look like at the micro-scale?
In the first injection phase, we initially saturate all four zones using an oil sample with 135 cP viscosity, followed by brine injection (5000 ppm CaCl2) to simulate the secondary water flooding process. Afterward, the polymer phase with 30 cP viscosity is injected into the device at 200 nL/min. Time-lapse images of each injection phase are taken every 2 seconds. Here, we can share what water flooding and polymer flooding look like in porous media with multiple permeabilities.
As shown in the video, water flooding did not show a good sweep performance due to unfavourable mobility ratios. We can clearly observe viscous-fingering effects in the top three zones while waterflood did not displace oil in the fourth zone, which has the lowest permeability. On the other hand, despite the fingers created by water flooding, polymer flooding showed much higher sweep efficiency through all four zones, providing significant incremental oil recovery.
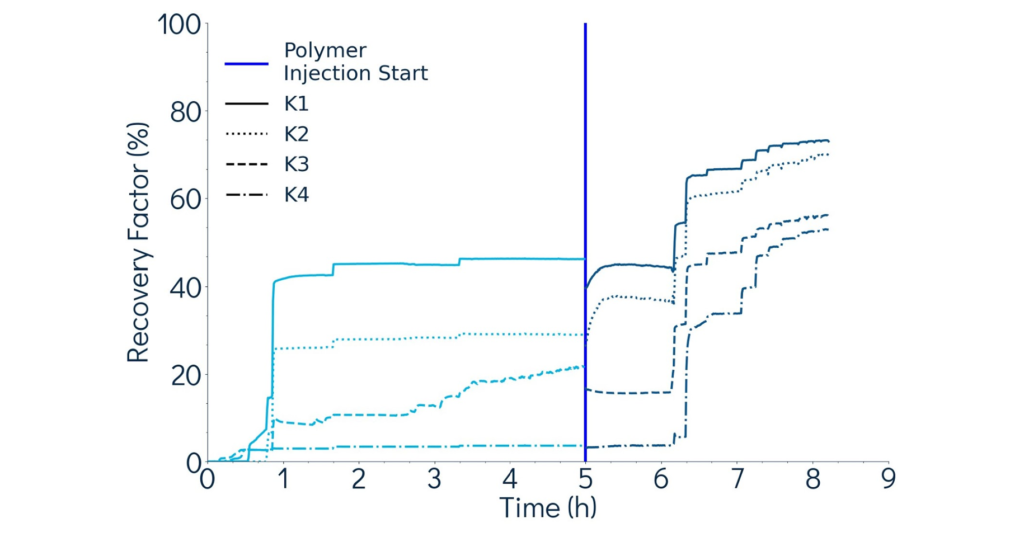
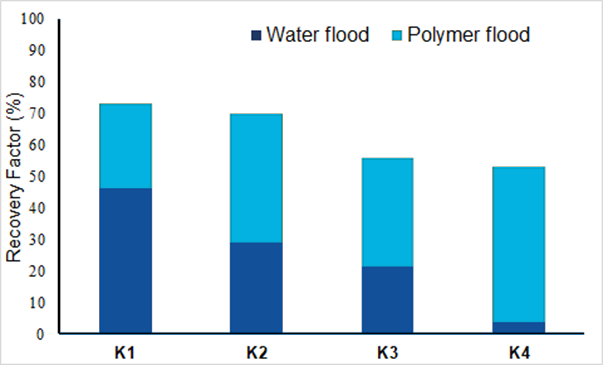
In addition to high-resolution optical visualization, we can provide quantitative analysis. Using an in-house image analysis algorithm, we obtain oil recovery data of each frame from the video and demonstrate the recovery factor against time, as shown in Figure 2. The final recovery factor bar chart shown in Figure 3 provides a direct comparison of the final recovery performance for all four zones. While the waterflood recovery factor decreased significantly in lower permeability zones (due to the faster waterfront advancement and early break-through in the higher permeability zones), the polymer flood effectively improved tertiary recovery from lower permeability zones, specifically Zone k4, which has the lowest permeability.
Bringing it all together
This work demonstrates – both visually and quantitatively – the performance of polymer flooding in reservoirs with heterogeneous layers, including thief zones. By increasing the viscosity of the injection water using polymers, significant incremental oil recovery is obtained even in the presence of highly permeable zones initially flooded by secondary water injection. Unlike the waterflooding that resulted in selective preferential paths and early break-through in high-permeable zones, polymer flooding can efficiently sweep through all four zones of different permeabilities. The microfluidic device developed here can be further employed to examine the rheology of various additives such as polymers, gels, viscoelastic fluids, and sealing agents to probe fluid mobility and conformance control in heterogeneous porous media with complex geometries. Overall, Interface’s technology enables operators to select the optimal chemical for a particular reservoir. Ultimately, this translates to higher rates of oil recovery and overall, more cost-effective EOR processes.
How will this technology help guide field operations?
The benefit of this technology is multifaceted. On a pure efficiency level, Interface’s microfluidic technology requires significantly smaller sample volumes than conventional testing methods and provides a detailed analysis of reservoir conditions within shorter durations of time. Building on this, the visual results produced by our microfluidic technology provide a more complete and realistic analysis of reservoir conditions – in addition to the repeatability and allowance for comparison – as operators can request a run of multiple reservoir conditions on a single chip.


